Posted 2019-10-23
In 1887, Thomas Mendenhall, a self-taught physicist, published an article in Science called “The Characteristic Curve of Composition,” in which he studies mathematical properties of sentences written by fiction writers of the day. As an early work of quantitative literary analysis which preexisted the field of digital humanities by many decades, I like to think of it as nonetheless a “digital” study in the literal sense, even if Mendenhall was counting on his fingers instead of using a computer. Of course, what would have been a laborious process for Mendenhall and, presumably, his assistants—counting the number of words in each sentence in a novel—is now just a matter of a few lines of code. So during a hackathon at the Literary Modeling and Visualization Lab, I decided to try to implement his algorithm.
Using primarily novels of Charles Dickens, Mendenhall counts the number of words per sentence, in chunks of a thousand words each, and plots their distribution in a histogram that looks like this:
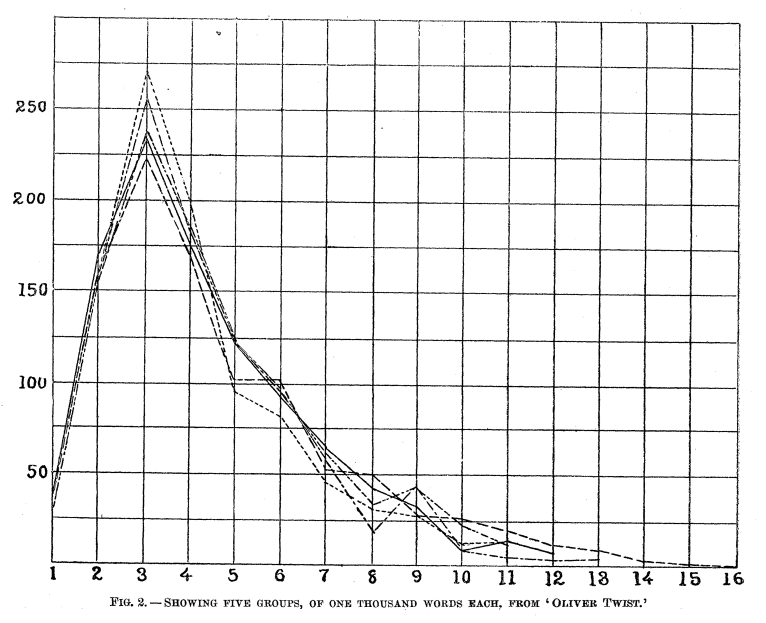
According to Mendenhall, this is Dickens’s “characteristic curve,” that is, his stylistic signature, as expressed in the distribution of sentence lengths. The X axis here represents the number of words in a sentence, and the Y represents the number of sentences in that category. He shows that for other novels, this curve is roughly the same as in these samples from Oliver Twist. The curves of other writers, however, are somewhat different. Nonfiction, like John Stuart Mill’s Essay on Liberty, is the most different, and other fiction is only slightly different.
During the hackathon, we decided to compare two genres of literary text: gothic novels and epistolary novels. Since Corpus-DB allows for easy corpus generation from genre (via Library of Congress subject headings), I was able to quickly throw together a corpus of about eight gothic novels and ten epistolary novels. From there, I used SpaCy to compute the distribution of sentence lengths, and group them by genre. This is the result, the “characteristic curve” of these two corpora:
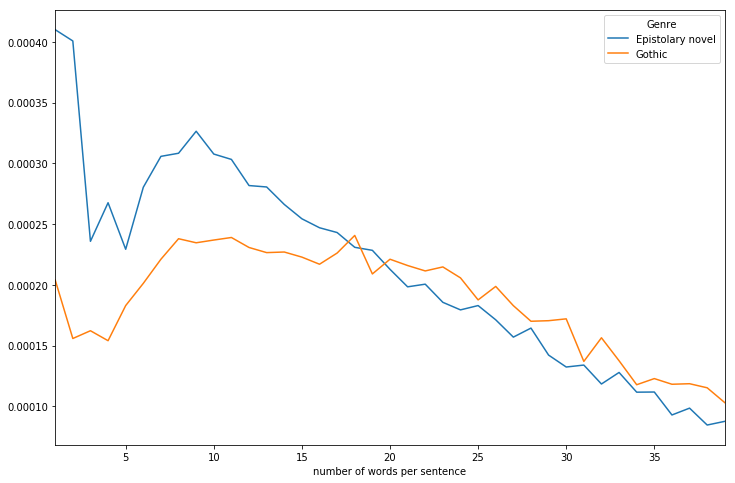
I should’ve used a bar chart here, since this is a histogram with discrete values, but in an effort to be faithful to Mendenhall’s method, I kept it as a line chart. I find it interesting that these two lines are so different from each other. The epistolary novels in this corpus have many more shorter sentences. I attribute this to formal features of the letter, like “Dear Sir,” and “Sincerely.” But then gothic novels have more longer sentences, that is, among sentences longer than twenty words.
Since these lines are so different, it seemed like this might be a good feature to use for a categorizer, which could guess the genre based on the sentence lengths of the novel. After scripting a quick function that compares the differences between all the categories in the histograms, I tried this, but only achieved an accuracy of 66%, so only slightly better than chance. Since some novels are both gothic and epistolary (Dracula comes to mind), I can see how this wouldn’t be an easy guess to make. Still, it’s something.
What other historical literary studies algorithms should I try to implement? Let me know in the comments below.