Posted 2017-01-04
In James Joyce’s novel Ulysses, the school headmaster Mr. Deasy quotes Shakespeare in a lecture in financial responsibility to his employee Stephen Dedalus. “[W]hat does Shakespeare say?” he asks, “Put but money in thy purse” (Joyce 1986, 25). As Stephen remembers it, however, this is not merely a saying of Shakespeare’s, but one spoken by Shakespeare’s infamous character Iago. So while Deasy thinks himself to be quoting the wisdom of the early modern playwright, he is, in fact, quoting the Bard’s most notorious arch-villain. This distinction—one between an author and the author’s fictional creations—is, it need not be said, crucial to the understanding of literature. It is that which the following experiment hopes to probabilistically detect.
The problem of computational character attribution is one of literary
knowledge production. In concrete terms, it is the difference between
the sentence “Madam, I never eat muscatel grapes” and its TEI XML
markup, <said who “Edmond
Dantès”>Madam, I never eat muscatel grapes</said>=. In the
first case, a reader familiar with The Count of Monte Cristo
might recognize it as spoken by Edmond Dantès; in the second case, the
reader (human or machine) need not know the work to attribute the
sentence to its speaker. When an entire novel is marked up in this way,
this allows for answers to a wide range of questions, such as the size
of the work’s cast of characters, the distribution of character speech,
and stylistic properties of individual characters. These are queries
that are useful for both close and distant reading—they can provide
insight about particular characters and the novel as a whole. They are
useful both to the close study of a single work and to the distant study
of hundreds or thousands of novels at a time. Although the task of
manually marking up a novel may be laborious for a human annotator, this
information might be generated semi-automatically from stylistic
signatures of the character. The following experiments will attempt to
test this hypothesis.
Experimental Design
The design of this series of experiments is based on Box’s Loop, an iterative process for refining a probabilistic model based on its predictive performance (D. M. Blei 2014, 205). The meta-analysis, then, is one of model selection, analysis, criticism, and improvement, while the analysis itself consists of four steps: chunking, vectorizing, dimensionality reduction, and prediction. Chunking involves the choice of documents, and the modification of those documents to fit certain lengths. (Each document only contains text in one character’s voice, but these documents might be of varying length.) Vectorizing is the transformation of those documents into numeric representations, whether through traditional “bag-of-words” term frequency representations or more semantic techniques. Dimensionality reduction transforms those high-dimensional vectors into lower-dimensional ones that are more easily manipulable by the predictive step. Prediction takes the transformed set of vectors and performs probabilistic inference, effectively assigning character voices to each document.
For each of these steps, there are many available techniques and parameters. To identify the best-performing ones, I used a cross-validation grid search that performs a meta-analysis by testing all permutations of these techniques.1 The grid search tests each configuration against an adjusted Rand score, which compares the labeled data with its predicted clusters. This metric accounts for chance, so that a score close to zero indicates a parameter configuration that performs no better than chance, while a score close to 1 is a perfect clustering, identical with the clustering of the original labels, although not necessarily labeled identically.
To test the efficacy of voice detection, I started with two TEI XML texts, distant from each other in time and genre: Virginia Woolf’s experimental 1931 novel, The Waves and Samuel Richardson’s classic 1748 epistolary novel Clarissa. The Waves is notable in that consists almost entirely of monologues spoken by six characters. Similarly, Clarissa is composed almost entirely of letters, mostly from four of the novel’s approximately 30 characters. These novels were chosen for their large proportions of character voices, and because they were already available in TEI XML format, which made possible the extraction of substantial amounts of labeled text.
The Waves
A manual, preliminary parameter search showed that character attribution worked best with utterances longer than four thousand characters. Furthermore, very long utterances, such as Bernard’s 66,000-character speech that ends the novel, threw off the analysis. With this in mind, I restricted the total 240 utterances of The Waves to just the 19 that were between 2000 and 20000 characters in length. The lengths of these documents conform roughly to a normal distribution, with a mean length of 6487 characters, and a standard deviation of 1960.
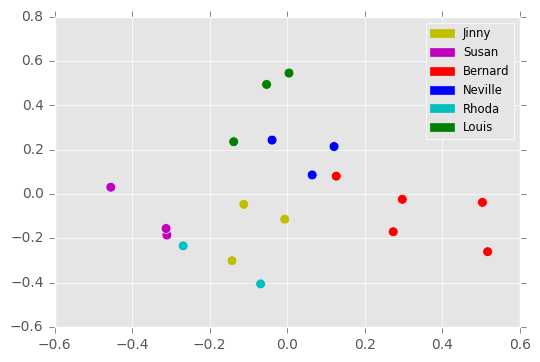
From there, I vectorized these documents using a TF-IDF vectorizer, which counts the frequency of each word, and reweights these according to how frequently they are used in the corpus. I set a maximum document frequency of 30% to ignore corpus-specific stop words, and then limited the vocabulary to the top 500 words (these are parameters suggested by the cross-validation search). The resulting vectors I then reduced to five dimensions using principal component analysis. This 19x5 matrix became the input for probabilistic inference. A two-dimensional projection of this matrix is shown in Figure 1A. Of note here is the apparent separation in this projection between the male and female characters, with the male characters in the upper right and the female characters in the lower left.
The probabilistic model used for clustering assumes that the
dimension-reduced, TF-IDF-weighted word frequencies can be modeled with
a mixture of Gaussians. I performed inference using Scikit-Learn’s GaussianMixture class, which uses the
expectation-maximization (EM) algorithm to cluster the data. Given six
components in which to cluster data, the algorithm clustered the data
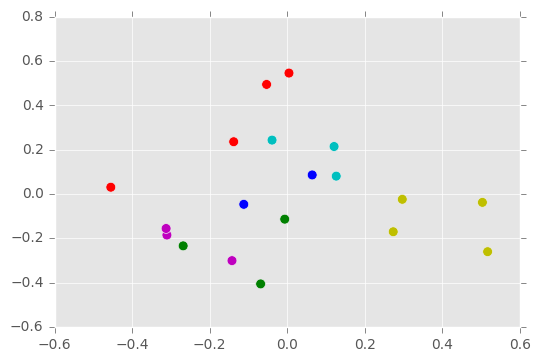
into the six groups shown in Figure 1B. The labels aren’t identical with
the original labels in Figure 1A, but the groupings are similar. The
inference correctly groups together four out of five of Bernard’s
utterances, three out of four of Louis’s, two out of three of Neville’s,
Rhoda’s, and Susan’s, but misidentifies Jinny’s. After twenty trials
with this configuration, the mean adjusted Rand score was 0.443, with a
standard deviation of 0.076—performing much better than chance, although
with room for improvement.2
Clarissa
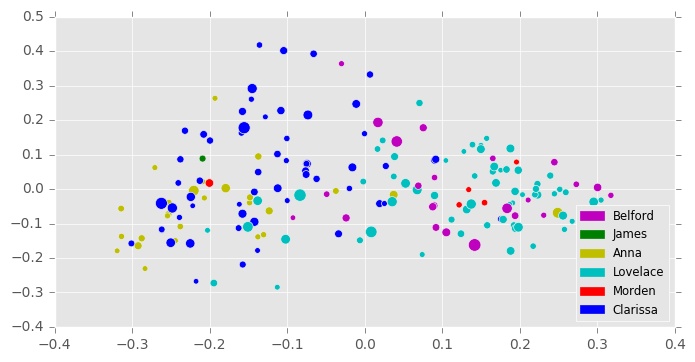
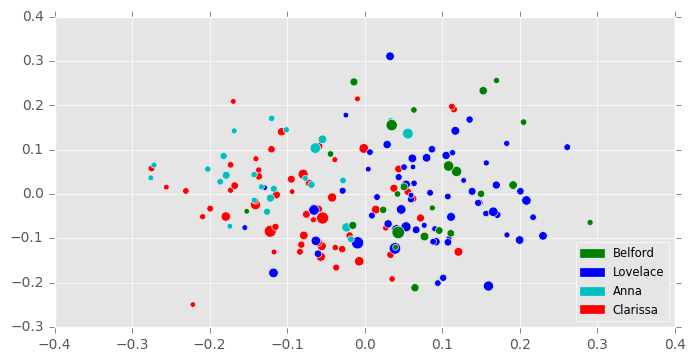
After manually tagging and extracting character-labeled letters from Richardson’s Clarissa, I generated test documents by selecting only letters longer than 8,000 characters and shorter than 50,000 characters. This produced a corpus of 180 letters of varying lengths, the relative lengths of which are indicated by the sizes of the dots in Figure 2. I then vectorized these documents using the top 500 most frequently used words, and reduced the resulting matrix to 25 principal components using PCA, the first two dimensions of which are shown in Figure 2A. As in the Waves experiment, these were all parameters suggested by the cross-validation grid search. Unlike the Waves experiment, however, the grid search suggested a slightly different inference model: a Bayesian Gaussian mixture model. This model differs from the Gaussian mixture model in that it uses variational inference techniques (see D. Blei 2016). Additionally, it doesn’t always find means for all clusters requested—only no more than those requested.
Curiously, the best parameters found by the grid search involved the configuration of the Bayesian Gaussian mixture model with four components, fewer than the number of characters. However, this turned out to have not been an error, since the amount of text represented by the relatively minor characters James and Morden (as evidenced by the paucity of green and red dots in Figure 2B) is very small, and it would almost be fair to assume that there are really only four characters represented here.
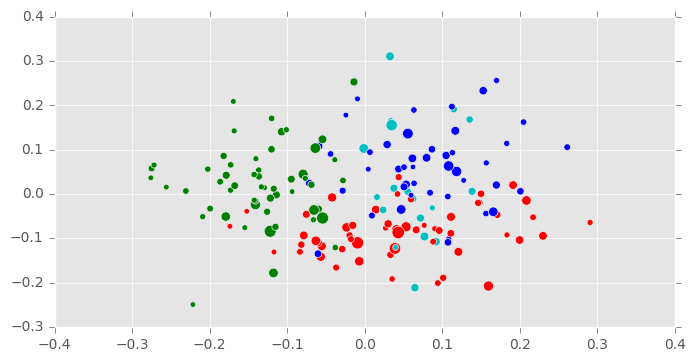
The final clustering is shown in Figure 2B. It incorrectly clusters together the correspondence of villains Lovelace and Belford, but forgivably, since these characters are friends and associates, and at most points in the novel partners in crime. It correctly identifies most of Anna’s correspondence, but divides her best friend Clarissa’s into two groups: one closer to Anna, and another closer to Lovelace. A closer analysis, which is perhaps beyond the scope of the present experiment, might reveal that those of Clarissa’s letters closest to Anna’s are letters in fact written to Anna, while her letters that appear closest to Belford and Lovelace might, in fact, be those written to them. In fact, the clustering here, though inaccurate, might be more useful to literary analysis than an accurate clustering: they might reveal not only the character voices themselves, but degrees or modes of these voices. They might show how voice changes according to addressee.
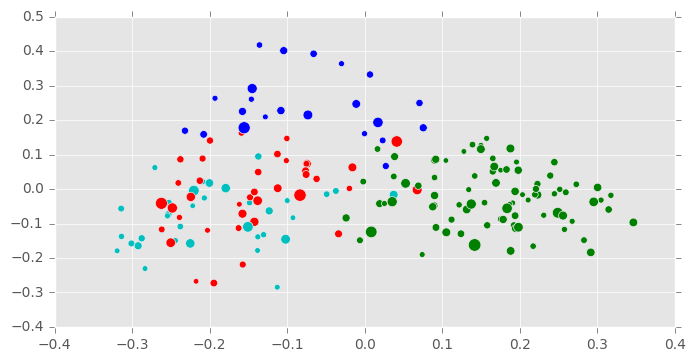
The adjusted Rand score for this clustering is a slightly lower 0.357, faring much better than chance, but still worse than The Waves. Although these experiments used different parameters and clustering techniques, this discrepancy might be telling.
Semantic Vectorization
The experiments above all rely on word frequency representations of text, and often only on the frequencies of the top 500 words (most likely function words). But what if other properties of the words, such as their meanings, were taken into account? First, I tried transforming documents into 300-dimensional vector representations using the GloVe algorithm in the SpaCy natural language processing Python library.3
The best configuration for this representation, using documents from the top four characters, reducing the dimensions to 5 with PCA, and performing inference with a Gaussian mixture model with four components, showed a mean adjusted Rand score of 0.192, with a standard deviation of 0.023 after twenty trials. Figure 3B shows the results of that experiment. Here, the probabilistic inference manages to separate, at the 0.0 longitudinal line, protagonists from antagonists, and male from female characters, grouping Anna and Clarissa together, and Lovelace and Belford. It does not seem to be able to distinguish between those individual characters, however.
I attempted other vectorizations, as well, without much success. A representation of a document as a vector of parts of speech frequencies produced scores roughly equal to those of chance. Another vectorization that represented documents as the frequencies of the root words in each sentence performed equally poorly. Since semantic word vectorizations performed only about half as well as the word frequency vectorizations described above, and similar representations even worse, we must conclude that character voice is most discernible in the frequencies of function words, rather than in the meanings of the words.
Discussion
The difference in the highest possible adjusted rand scores for each novel—0.443 for The Waves, and 0.357 for Clarissa—might be a useful observation, even though these scores were arrived at with very different processes. Perhaps the respective scores indicate the degree to which these novelists are able to write in the styles of their characters. Conversely, this difference might indicate the degree to which these writers chose the stylistic diversity of their characters. If that is the case, novelists with many classes of broadly-painted characters such as Charles Dickens might show higher scores than novelists like Jane Austen, who deal with social subtleties.
Although the technique outlined in this paper might not be appropriate for fully unsupervised character voice attribution, semi-automatic attribution might be possible with some manual tagging of groups. In any case, attributions of very small utterances (with fewer than 2,000 characters) may not be possible with this word frequency representation.
If these techniques do not prove to be very useful in automating character voice attributions, however, they might be useful to literary studies in other ways. By examining the confusion caused by certain probabilistic clusterings, for instance, we might be able to find groups of characters—male and female characters, for instance, or protagonists and antagonists. By using an unsupervised model such as the Bayesian Gaussian model used with Clarissa, we might also be able to infer, with some small degree of confidence, the numbers of main characters. In some cases, groupings among documents or utterances might reveal hidden affinities among characters, as well, or stylistic changes in a character’s voice correlated with his or her addressee(s).
Note
This paper is also available as a PDF at the project’s GitHub repository.
References
Blei, David. 2016. “Variational Inference: A Review for Statisticians,” November.
Blei, David M. 2014. “Build, Compute, Critique, Repeat: Data Analysis with Latent Variable Models.” Annual Review of Statistics and Its Application 1: 203–32. http://www.annualreviews.org/doi/abs/10.1146/annurev-statistics-022513-115657.
Joyce, James. 1986. Ulysses. Edited by Hans Walter Gabler. 1st edition. New York: Vintage.
Pennington, Jeffrey, Richard Socher, and Christopher D. Manning. 2014. “GloVe: Global Vectors for Word Representation.” In Empirical Methods in Natural Language Processing (EMNLP), 1532–43. http://www.aclweb.org/anthology/D14-1162.
Turian, Joseph, Lev Ratinov, and Yoshua Bengio. 2010. “Word Representations: A Simple and General Method for Semi-Supervised Learning.” In Proceedings of the 48th Annual Meeting of the Association for Computational Linguistics, 384–94. Association for Computational Linguistics. http://dl.acm.org/citation.cfm?id=1858721.
A full list of techniques and parameters tested may be found in the project repository, in the grid search notebooks for The Waves and for Clarissa.↩︎
The code used for this analysis, written in the Python programming language and using the Scikit-Learn machine learning library, is available at this project’s GitHub repository.↩︎
See Pennington, Socher, and Manning (2014) for more on GloVe, and Turian, Ratinov, and Bengio (2010) for more on word vector embeddings in general.↩︎